Profiling is about measuring the performance of PHP code, at least when we are talking about Drupal and Xdebug. You might need to profile your site or app if you work at a firm where performance is highly scrutinized, or if you are having problems getting a migration to complete. Whatever the reason, if you have been tasked with analyzing the performance of your Drupal codebase, profiling is one great way of doing so. Note that Xdebug’s profiler does not track memory usage. If you want to know more about memory performance tracking you should check out Xdebug’s execution trace features.
Alright then lets get started!
Whoa there cowboy! First you need to know that the act of profiling your code is itself taking resources to accomplish. The more work your code does, the more information that the profiler stores; file sizes for these logs can get very big very quickly. You have been warned. To get going with profiling Drupal in PHPStorm and Xdebug you need:
To setup your environment, edit your php.ini file and add the following lines:
xdebug.profiler_output_dir=/tmp/profiler/
xdebug.profiler_enable=on
xdebug.profiler_trigger=on
xdebug.profiler_append=on
Depending on what you are testing and how, you may want to adjust the settings for your site. For instance, if you are using Drush to run a migration, you can’t start the profiler on-demand, and that affects the profiler_trigger setting. For my dev site I used the php.ini config you see above and simply added a URL parameter “XDEBUG_PROFILE=on” to my site’s url; this starts Xdebug profiling from the browser.
To give you an idea of what is possible, lets profile the work required to view a simple Drupal node. To profile the node view I visited http://profiler.loc/node/48581?XDEBUG_PROFILE=on in my browser. I didn’t see any flashing lights or hear bells and whistles, but I should have a binary file that PHPStorm can inspect, located in the path I setup in my php.ini profiler_output_dir directive.

Finally lets look at all of our hard work! In PHPStorm navigate to Tools->Analyze Xdebug Profile Snapshot. Browse to your profiler output directory and you should see at least one cachgrind.out.%p file (%p refers to the process id the script used). Open the file with the largest process id appended to the end of the filename.
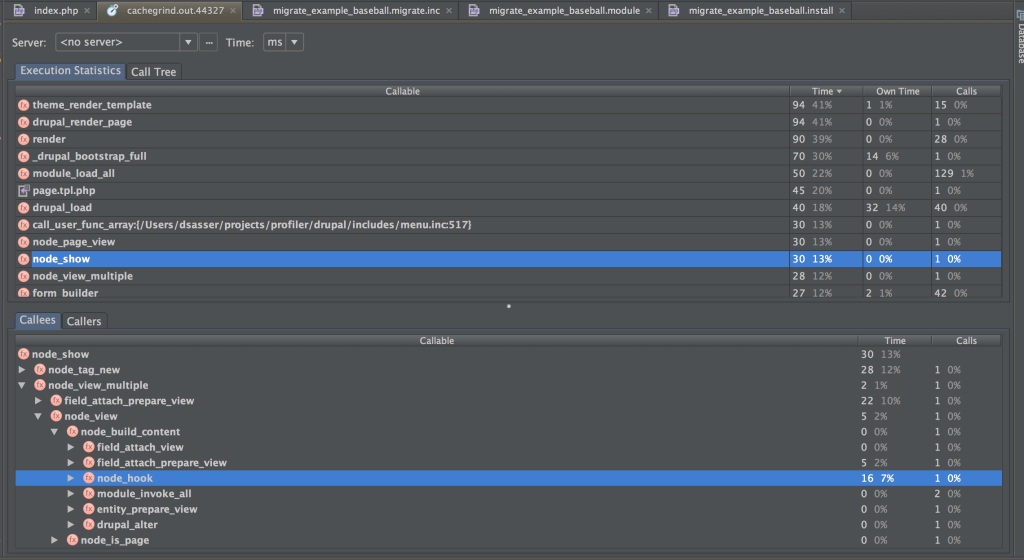
We are then greeted with a new tab showing the results of the profiler.
The output shows us the functions called, how many times they were called, and the amount of execution time each function took. Additionally, you can see the hierarchy of all function calls and follow potential bottlenecks down to their roots.
There you have it! Go wild and profile all the things! Just kidding, don’t do that.


")


")
